If you would like to publish your own Google Map, but do not have a server to place it on, there are some greate options to get you started without needing a server.
I ran across this web page recently that has a number of excellent tutorials for using Google's Page Creator. The Google Pages site is fantastic for putting together really quick and easy web pages. It also will let's you publish your own Google Maps Web Page using the this tutorial.
I used this tutorial to put together my own sample Google Map. This is pretty basic, but could be spiced up quite a bit with added funtionality.
Thursday, January 10, 2008


Saturday, January 05, 2008
Creating Hybrid Spatial Solutions: Commercial and Open Source
Open source geospatial systems and tools have really taken off in recent years, as has the open source community at large. While an open source geospatial solution may be enticing to some GIS managers, there remain a number of hurdles for them to be effectively employed.
Chief among these hurdles are the lack of documentation, training, and the added difficulties of configuring or extending open source solutions (it’s tough to get a good ArcSDE administrator, it’s tougher still to get a good PostGIS administrator). In addition to this, while open source is starting to provide a rather comprehensive suite of software that includes desktop and web based GIS tools and services, as well as database storage and support, they still tend to lack a good data management framework. I suspect that the reason for this is because developers of open source spatial software want their work to be able to do something relatively fast. So they tend to make them work on existing GIS data (such as shapefiles) rather then put a heavy emphasis on creating and managing spatial data from scratch.
Most GIS may be reluctant to move too quickly towards an open source solution when they already have a functionally proprietary system in place. Even though moving towards open source may be compelling due to the potential cost savings in licensing fees, those savings are offset by concerns over being able to manage the system and maintain current capabilities.
The most likely scenario in the near future is to start seeing the appearance of hybrid solutions.
As an example, a GIS shop may decide that their use of ArcEditor (or ArcInfo), ArcSDE and ArcIMS (or ArcServer) may be overkill for their specific requirements. While this software provides an enormous amount of capability, this may not actually be required. It may be possible for them to effectively manage their spatial data using an ArcMap license to manage the spatial data, and then have that data pushed into a PostGIS database for corporate or enterprise attribute editing and visualization. The key is to leverage the power of both commercial and open source solutions towards cheaper and oftentimes more powerful solution.
Chief among these hurdles are the lack of documentation, training, and the added difficulties of configuring or extending open source solutions (it’s tough to get a good ArcSDE administrator, it’s tougher still to get a good PostGIS administrator). In addition to this, while open source is starting to provide a rather comprehensive suite of software that includes desktop and web based GIS tools and services, as well as database storage and support, they still tend to lack a good data management framework. I suspect that the reason for this is because developers of open source spatial software want their work to be able to do something relatively fast. So they tend to make them work on existing GIS data (such as shapefiles) rather then put a heavy emphasis on creating and managing spatial data from scratch.
Most GIS may be reluctant to move too quickly towards an open source solution when they already have a functionally proprietary system in place. Even though moving towards open source may be compelling due to the potential cost savings in licensing fees, those savings are offset by concerns over being able to manage the system and maintain current capabilities.
The most likely scenario in the near future is to start seeing the appearance of hybrid solutions.
As an example, a GIS shop may decide that their use of ArcEditor (or ArcInfo), ArcSDE and ArcIMS (or ArcServer) may be overkill for their specific requirements. While this software provides an enormous amount of capability, this may not actually be required. It may be possible for them to effectively manage their spatial data using an ArcMap license to manage the spatial data, and then have that data pushed into a PostGIS database for corporate or enterprise attribute editing and visualization. The key is to leverage the power of both commercial and open source solutions towards cheaper and oftentimes more powerful solution.
Thursday, October 04, 2007
SDSFIE Data Dictionaries for Trimble GPS
The Spatial Data Standards for Facilities, Infrastructure, and Environment (SDSFIE) provides a template for creating standardized geospatial standard for storing data. There are tools that can be used to automatically create SDSFIE Geodatabases (as well as other formats), but there have been no tools that could automatically generate SDSFIE compliant Data Dictionaries to be used for data collection by Trimble GPS units. The SDS2DDF application was designed to do just that.
The SDS2DDF is a VB 6 application that creates an ascii file that can be imported into Trimbles Data Dictionary Editor, and then into their GeoExplorer (and other) GPS receivers for field collection.
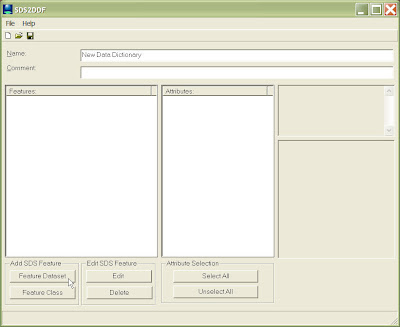
The above graphic shows the SDS2DDF as soon as it has been opened. Users can select to navigate through SDSFIE Feature Classes either by class, or grouped by Feature Dataset. The browser below shows the browse by Feature Dataset option. Users can also conduct a search by keyword to find a Feature Class that best meets there needs.
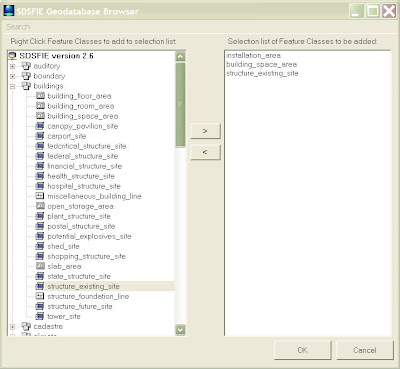
The user above has selected three Feature Classes. After selecting OK, the Feature Classes are loaded into the Main application screen (below).

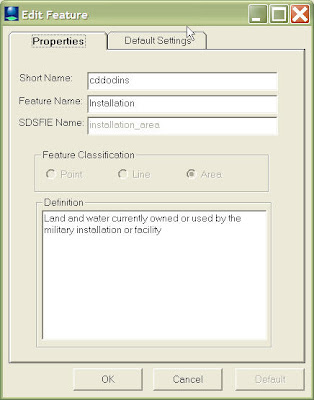
Users can also change certain aspects on how the data is collected by the GPS receiver.

Once complete, the file is saved as an ASCII file (below).

 The data can then be modified and saved as a DDF file for use in a Trimble GPS receiver.

The SDS2DDF is a VB 6 application that creates an ascii file that can be imported into Trimbles Data Dictionary Editor, and then into their GeoExplorer (and other) GPS receivers for field collection.
The above graphic shows the SDS2DDF as soon as it has been opened. Users can select to navigate through SDSFIE Feature Classes either by class, or grouped by Feature Dataset. The browser below shows the browse by Feature Dataset option. Users can also conduct a search by keyword to find a Feature Class that best meets there needs.

The user above has selected three Feature Classes. After selecting OK, the Feature Classes are loaded into the Main application screen (below).

Users can then browse through all of the loaded attributes for each Feature Class and determine which ones they would like to export to the final data dictionary. They can also view the description and domain values (if present) for each attribute field.
Users can also change certian properties for each feature, such as the alias name to be used (below).

Users can also change certain aspects on how the data is collected by the GPS receiver.

Once complete, the file is saved as an ASCII file (below).
To get the data into Trimble's Data Dictionary Editor, the user just selects 'Import ASCII file" from the 'File' menu.
 The data can then be modified and saved as a DDF file for use in a Trimble GPS receiver.
Wednesday, September 05, 2007
Microsoft Photosynth Promises a Truly Immersive Experience
Microsoft's Photosynth


Photosynth is a remarkable product that is being developed by Microsoft in their Live Labs. It can merge hundreds of photos from many different angles to create a truly incredible, fluid, visual experience. I found its navigation to be extremely easy and flexible.
I can only imagine what capabilities this might provide if they merge it with Virtual Earth. This may provide a truly immersive experience at many different scales. Users could zoom from the macro to micro in an instance. It appears to be able to server an enormous amount of data very quickly.
It looks like Photosynth is part of a larger effort to change how we can visually interact with our limited monitors (check out Seadragon). This promises to deliver some very exciting results in the not to distant future for the geo-community.
I can only imagine what capabilities this might provide if they merge it with Virtual Earth. This may provide a truly immersive experience at many different scales. Users could zoom from the macro to micro in an instance. It appears to be able to server an enormous amount of data very quickly.
It looks like Photosynth is part of a larger effort to change how we can visually interact with our limited monitors (check out Seadragon). This promises to deliver some very exciting results in the not to distant future for the geo-community.
You can download Photosynthes from the Live Lab website. There are also a couple of good videos to watch at the Live Lab site, and on at TED.
Flight Simulator Built into Google Earth 4.2
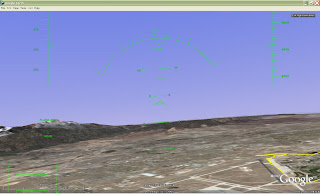
A friend pointed out to me today that there is a hidden feature in the new Google Earth 4.2 release. If you click on the Earth and hit ctrl+alt+a, you will get a dialog box for a flight simulation mode in Google Earth flying either an F-16 or an SR22 aircraft. You can also select to start from an airfield, or from your current point of view. A heads-up display appears as soon as you get into the flight mode.
After you have entered this mode for the first time, you will be able to access it from the Tools menu in Google Earth.
I do not have a joystick on my computer, and the control seem to be a bit touchy, but this is very interesting as a hidden feature. Keep your fingers crossed that they keep working on this and turn it into something useful.

Click Ctrl + Alt + A after clicking on the globe to activate. Once activated, Enter Flight Mode is available from the Google Earth Tools menu
After you have entered this mode for the first time, you will be able to access it from the Tools menu in Google Earth.
I do not have a joystick on my computer, and the control seem to be a bit touchy, but this is very interesting as a hidden feature. Keep your fingers crossed that they keep working on this and turn it into something useful.
Click Ctrl + Alt + A after clicking on the globe to activate. Once activated, Enter Flight Mode is available from the Google Earth Tools menu

Fly around with a Heads up Display.
Sunday, August 19, 2007
GIS and KML
When Google released Google Earth as a free download several years ago, people quickly learned what Keyhole Markup Language (KML). GIS professionals were quick to build translators to convert their data from several different formats into KML for viewing in Google Earth. The better of these tools let the user maintain the mapping symbology from their GIS software platform into the KML.
In the last couple of years, and enormous amount of geospatial data has been converted to KML to be viewed in Google Earth. In response, may geospatial visualization packages started to let users load KML into their own viewers. So where does KML actually fit into the whole geospatial realm? Will it become a standardized way to store geospatial data?
KML has a couple of things going for it. It’s based on XML and is well documented. It represents a pretty good method for encoding spatial data and symbology (and, to a lesser extent, attribution). But by far the biggest thing KML has going for it is that it is native to Google Earth. To that end, KML is really oriented toward defining displayable geospatial data. I have yet to see any code that performs any geosprocessing on KML, and there is a lot of overhead with KML then with, as an example, a shapefile.
So where does KML fit in compared to GIS data? I think that the answer to that lies with what people with a GIS background typically do with KML. They dynamically generate it from traditional geospatial data stores (shapefiles, geodatabases, etc), and they allow their own viewers to load and see KML files.
KML is serving the role that is usually found within GIS software. Whenever a file is loaded, a symbology class is assigned to it to define how the data will look in the map. Most people, other than programmers, never actually see this information. They only see the windows that let them alter the symbology of data, and the data itself. Some GIS packages allow users to save “layer” information that references the originating spatial data (an ESRI ‘.lyr’ file is an example).
So, in conclusion, it appears that KML represents what is typically in in-memory representation of geospatial and symbology data in most geospatial software applications, offering KML authors a very unique, open, specification at that level of representation.
In the last couple of years, and enormous amount of geospatial data has been converted to KML to be viewed in Google Earth. In response, may geospatial visualization packages started to let users load KML into their own viewers. So where does KML actually fit into the whole geospatial realm? Will it become a standardized way to store geospatial data?
KML has a couple of things going for it. It’s based on XML and is well documented. It represents a pretty good method for encoding spatial data and symbology (and, to a lesser extent, attribution). But by far the biggest thing KML has going for it is that it is native to Google Earth. To that end, KML is really oriented toward defining displayable geospatial data. I have yet to see any code that performs any geosprocessing on KML, and there is a lot of overhead with KML then with, as an example, a shapefile.
So where does KML fit in compared to GIS data? I think that the answer to that lies with what people with a GIS background typically do with KML. They dynamically generate it from traditional geospatial data stores (shapefiles, geodatabases, etc), and they allow their own viewers to load and see KML files.
KML is serving the role that is usually found within GIS software. Whenever a file is loaded, a symbology class is assigned to it to define how the data will look in the map. Most people, other than programmers, never actually see this information. They only see the windows that let them alter the symbology of data, and the data itself. Some GIS packages allow users to save “layer” information that references the originating spatial data (an ESRI ‘.lyr’ file is an example).
So, in conclusion, it appears that KML represents what is typically in in-memory representation of geospatial and symbology data in most geospatial software applications, offering KML authors a very unique, open, specification at that level of representation.
Targeted Solutions with ArcGIS Explorer
ArcGIS Explorer is described by ESRI as being a “lightweight client for ArcServer”. Interestingly, ArcGIS Explorer is not actually tied to any other ESRI products. It and an SDK to develop customized tasks are free to download, and (as far as I can tell) free to deploy.
What this means is that ArcGIS Explorer can be used as an interface for all sorts of geospatial applications in a manner similar to Google Earth, Virtual Earth, and WorldWind using free and open source geospatial software components. Any processing logic that can be connected to any of these earth browsers can similarly be connected to ArcGIS Explorer. The current strength of ArcGIS Explorer in this category is the ability to customize the interface to hold any new toolsets.
I am really hoping to be able to work on some targeted geospatial applications that can very cheaply take advantage to this visualization platform.
What this means is that ArcGIS Explorer can be used as an interface for all sorts of geospatial applications in a manner similar to Google Earth, Virtual Earth, and WorldWind using free and open source geospatial software components. Any processing logic that can be connected to any of these earth browsers can similarly be connected to ArcGIS Explorer. The current strength of ArcGIS Explorer in this category is the ability to customize the interface to hold any new toolsets.
I am really hoping to be able to work on some targeted geospatial applications that can very cheaply take advantage to this visualization platform.
Tuesday, January 09, 2007
Google Earth as a Geographic Information System
The first work that I did with Google Earth and KML was to build a converter in ArcMap that would export all of the selected layers out to KML. We used this for an emergency response tool set that worked in ArcMap. The idea was that the mapping would be managed by someone trained in using GIS who would them automatically kick-out KML updates to a server to be viewed using GE networklinks by commanders.
This worked really well, but at the time, I wondered if it would be possible for Google Earth to act more as an interactive partner rather than a static viewer. When it came to having GIS capabilities, Google Earth has never really been considered (for good reason).
However, the more I thought about it, the more I wondered if GIS type functions used for command and control applications could not be accessed and used by Google Earth. What I really wanted to do was to used open-source functions with not license restrictions to create a GIS back end, and then have Google Earth act as the interface.
When Google Earth officially announced that they had a COM API, I started looking a bit more at the possibility of being able to interact more effectively with Google Earth. I noticed some update functions that I thought might help . I first mentioned this in the beginning of December when I wrote New Google Earth API Allows for GIS Type Interaction.
I was able to use this new API function to select coordinates directly from Google Earth. This has huge implications, as I can use these coordinates to Select and Identify GIS data. I can now marry this capability with Shape2Earth, which allows me to Import GIS directly into Google Earth.
So, now I can load GIS data directly into Google Earth, and I can query and select this data using Google Earth. The next thing I want to do is actually create data and launch geoprocessing functions from Google Earth. Here is how I do that.
To start with, I have the Google Earth Render window embedded in my application (I'm using GoogleEarthAirlines to do this), and I have loaded GIS data using a modified form of Shape2Earth.
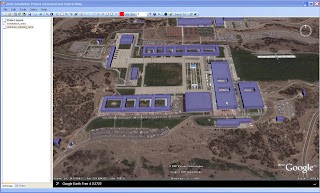
To show how I can interact with Google Earth similar to a GIS, I'll walk through an emergency response scenario. I am given a building at which there is an incident, I can do a quick search using either the building name, ID, or a coordinate. I use MapWindow GIS components to search for the building information in the shapefile, and then zoom to the location.
When I get to the area of interest, I want to Cordon (buffer) off the affected area. I first select my Cordon tool and click on Google Earth to set the center point (I could also select the building and create a cordon around that). The point (or selected feature) is sent to my cordon tool. I then select the size of the cordon, the measurement units (feet, meters, etc.), and the number of rings I would like. In this case, 2000 feet with 1 ring.
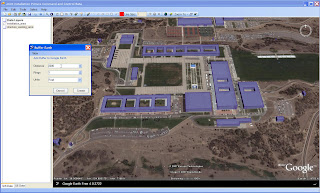 MapWindow GIS components are used to create the buffer (shown below). Shape2Earth creates a kml file and a shapefile to represent the new geospatial data set.
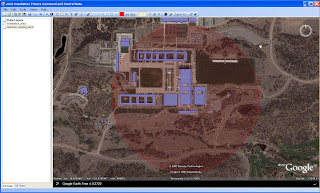 The next thing I want to do is determine what buildings are impacted by this event. MapWindow GIS components select the buildings using the cordon polygon. Shape2Earth modifies the color of the kml and reloads is quickly into Google Earth (see below). The same process is used to select affected roads, and to set up traffic control points to isolate the area.
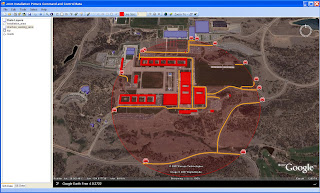
Since my GIS data and KML are linked, and I can grab coordinates off of the map, I can change the status of buildings simply by clicking on them in Google Earth (note that the orientation of Google Earth does not matter, not does the location that you click). This brings up a dialog box that lets me edit the GIS data which also changes the color of the KML.
 Above, GIS data is selected and edited directly in Google Earth.
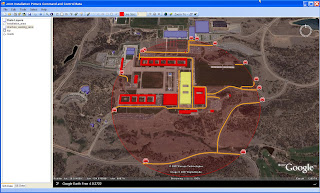
Combining the visualization of Google Earth with the power of GIS leads to some very effective capabilities. The data can be immediately served out to other clients, such as another Google Earth as seen in the graphics below.

GIS Data viewed and edited in Google Earth above
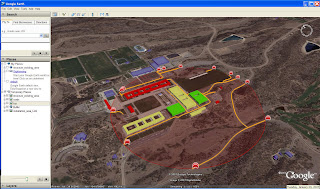
Created GIS data viewed in another Google Earth Client in near real-time
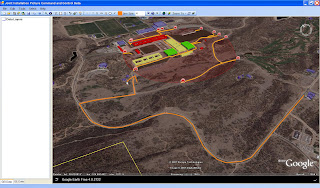
Besides being able to edit GIS attribute data, we can create GIS data by digitizing directly on Google Earth. The graphic above shows a sketched route that is converted to a shapefile.
This worked really well, but at the time, I wondered if it would be possible for Google Earth to act more as an interactive partner rather than a static viewer. When it came to having GIS capabilities, Google Earth has never really been considered (for good reason).
However, the more I thought about it, the more I wondered if GIS type functions used for command and control applications could not be accessed and used by Google Earth. What I really wanted to do was to used open-source functions with not license restrictions to create a GIS back end, and then have Google Earth act as the interface.
When Google Earth officially announced that they had a COM API, I started looking a bit more at the possibility of being able to interact more effectively with Google Earth. I noticed some update functions that I thought might help . I first mentioned this in the beginning of December when I wrote New Google Earth API Allows for GIS Type Interaction.
I was able to use this new API function to select coordinates directly from Google Earth. This has huge implications, as I can use these coordinates to Select and Identify GIS data. I can now marry this capability with Shape2Earth, which allows me to Import GIS directly into Google Earth.
So, now I can load GIS data directly into Google Earth, and I can query and select this data using Google Earth. The next thing I want to do is actually create data and launch geoprocessing functions from Google Earth. Here is how I do that.
To start with, I have the Google Earth Render window embedded in my application (I'm using GoogleEarthAirlines to do this), and I have loaded GIS data using a modified form of Shape2Earth.

To show how I can interact with Google Earth similar to a GIS, I'll walk through an emergency response scenario. I am given a building at which there is an incident, I can do a quick search using either the building name, ID, or a coordinate. I use MapWindow GIS components to search for the building information in the shapefile, and then zoom to the location.
When I get to the area of interest, I want to Cordon (buffer) off the affected area. I first select my Cordon tool and click on Google Earth to set the center point (I could also select the building and create a cordon around that). The point (or selected feature) is sent to my cordon tool. I then select the size of the cordon, the measurement units (feet, meters, etc.), and the number of rings I would like. In this case, 2000 feet with 1 ring.
 MapWindow GIS components are used to create the buffer (shown below). Shape2Earth creates a kml file and a shapefile to represent the new geospatial data set.
 The next thing I want to do is determine what buildings are impacted by this event. MapWindow GIS components select the buildings using the cordon polygon. Shape2Earth modifies the color of the kml and reloads is quickly into Google Earth (see below). The same process is used to select affected roads, and to set up traffic control points to isolate the area.
All of these new data are saved as kml with associated shapefiles as described in Importing GIS Data into Google Earth.

Since my GIS data and KML are linked, and I can grab coordinates off of the map, I can change the status of buildings simply by clicking on them in Google Earth (note that the orientation of Google Earth does not matter, not does the location that you click). This brings up a dialog box that lets me edit the GIS data which also changes the color of the KML.
 Above, GIS data is selected and edited directly in Google Earth.
Below, the KML file is update and reloaded.

Combining the visualization of Google Earth with the power of GIS leads to some very effective capabilities. The data can be immediately served out to other clients, such as another Google Earth as seen in the graphics below.

GIS Data viewed and edited in Google Earth above

Created GIS data viewed in another Google Earth Client in near real-time

Besides being able to edit GIS attribute data, we can create GIS data by digitizing directly on Google Earth. The graphic above shows a sketched route that is converted to a shapefile.
Importing GIS Data into Google Earth
Google Earth has often been described as a geospatial data browser. The reason for this is simple ... while Google Earth is fantastic for visualization, it does not do (nor has it been intended to do) many traditional GIS tasks. As an example, you cannot really query GIS data or directly access attribute data. You also cannot edit or manage geospatial data. Google Earth is really intended to do one thing very well, and that is to display geospatial data on a visually appealing framework. There have been many efforts by a lot of people to try and wring GIS type capabilities out of Google Earth. Many of the more successful ones used a combination of network links and data embedded in the description tag (and visible in the callout balloon) to link points to other data available on servers. What would really make things easier would be if users could click on Google Earth and grab coordinates. If we could do this, then we could attach geospatial capabilities behind Google Earth to make it act as a GIS interface. The new Google Earth API (and a lot of trickery) have now made that possible. The first thing I wanted to do was to be able to create toolbars that could be accessible in Google Earth. Since I could not do that, I started looking into grabbing the Google Earth Windows handle so that I could embed the viewer in my application. I had a 75% solution in the bag when I stumbled on GoogleEarthAirlines. GoogleEarthAirlines is an ActiveX control written in Delphi that does just what I was planning to do. When I found this, I put my control on the backburner and started using this. The graphic below shows the GoogleEarthAirlines control in my application.

Shape2Earth is used to create height values of GIS Data
 Basic colors for the output KML are selected

A Unique ID is selected from the Attribute field. This will be used to attach to databases through Google Earth
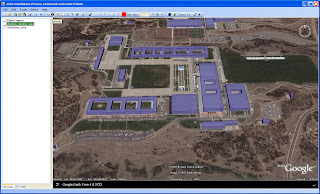 The steps above walk through loading a shapefile into the Google Earth GIS application. Now, we use our trickery to click on Google Earth and grab a coordinate. This is done using the method described here.
The great thing about this method is that it does not matter what the orientation of Google Earth is. It will always return the coordinate that you clicked.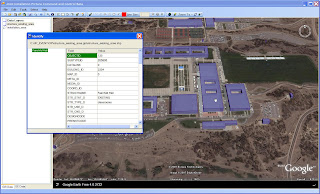
The same method can be used to select multiple features, as is shown below.
 Select Tool lets the user drag a selection box across Google Earth
 MapWindow components are used to select the geospatial features and display their attributes

The plan now is to link GIS data with KML. KML will act as the layer file that does nothing more than render my GIS data. to get the GIS data into Google Earth, I used a modified form of Shape2Earth. Shape2Earth converts the shapefiles to KML, and then writes an XML file that links the two files together.

Shape2Earth is used to create height values of GIS Data
 Basic colors for the output KML are selected
A Unique ID is selected from the Attribute field. This will be used to attach to databases through Google Earth
 The steps above walk through loading a shapefile into the Google Earth GIS application. Now, we use our trickery to click on Google Earth and grab a coordinate. This is done using the method described here.
The great thing about this method is that it does not matter what the orientation of Google Earth is. It will always return the coordinate that you clicked.
In the graphic below, I have selected the ID button, and then clicked on a building. The application uses geoprocessing capabilities provided by the open source GIS application MapWindow. It loads the selected shapefile, and uses the coordinate to determine what has been selected. The result is the ability to directly access geospatial attribute data by clicking directly in Google Earth.

The same method can be used to select multiple features, as is shown below.
 Select Tool lets the user drag a selection box across Google Earth
 MapWindow components are used to select the geospatial features and display their attributes
Now that we can do some basic GIS type functions directly in Google Earth, we can start doing more sophisticated workflows. The next step is to actually create GIS data directly in Google Earth. That has already been done, and will be posted here shortly.
Thursday, January 04, 2007
Shape2Earth Version 1.0
After three beta testing periods, and a lot of new enhancements and optimizations, Shape2Earth Version 1.0 has been released for download at http://shape2earth.com/.
Shape2Earth uses freely available Geographic Information System (GIS) software to convert shapefiles into color coded Keyhole Markup Language (KML) files for visualization in Google Earth.
Shape2Earth provides a powerful tool for people and organizations who do not wish to invest thousands of dollars in professional GIS software in order to create powerful and compelling visual information. Shape2Earth can also quickly expand the capability of those who already have a significant investment in GIS for the lowest price possible.
Download Shape2Earth, and then look at the online blog to see what shape2earth can do for you.
Shape2Earth uses freely available Geographic Information System (GIS) software to convert shapefiles into color coded Keyhole Markup Language (KML) files for visualization in Google Earth.
Shape2Earth provides a powerful tool for people and organizations who do not wish to invest thousands of dollars in professional GIS software in order to create powerful and compelling visual information. Shape2Earth can also quickly expand the capability of those who already have a significant investment in GIS for the lowest price possible.
Download Shape2Earth, and then look at the online blog to see what shape2earth can do for you.
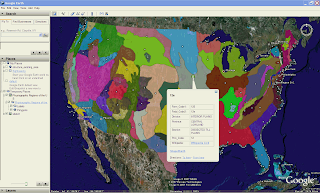
Physiographic Regions of the U.S.
Saturday, December 09, 2006
Labeling KML Part 2
I wrote previously on how Shape2Earth can now create center-points from polygons that can be used for labeling. The next thing I need to do is create the same functionality for lines. This is a bit trickier than for polygons. Imagine using the bounding envelope for the Missouri River to create a center-point to label the River. Its just not going to be in a very effective place.
The idea I am going to take a crack at is to use one of the points in the feature itself. I'll probably just pick the middle point and use that as the label. This should get the label reasonably close, and then let users make minor adjustments to its location in Google Earth.
The idea I am going to take a crack at is to use one of the points in the feature itself. I'll probably just pick the middle point and use that as the label. This should get the label reasonably close, and then let users make minor adjustments to its location in Google Earth.
Thursday, December 07, 2006
New Google Earth API Allows for GIS Type Interaction
I am not sure that this is what the Google Earth engineers had in mind when they released it, but new COM API exposes a method called “GetPointOnTerrainFromScreenCoords”.
If you pass this method normalized screen coordinates from the GE Render window, it will return the Latitude, Longitude, and elevation of that point in Google Earth. This opens up an enormous amount of potential for using Google Earth as your GIS interface.
Google has always maintained that they are not a GIS, and they are right. But they have a great visualization system. All that is needed is a way to interact with their interface in a way that makes sense for GIS types of applications. All of the GIS activity can than go on behind the scene.
As an example, I can now click anywhere on Google Earth and capture the coordinates. I can also drag a rectangle across the screen and define its actual location within GE. I can then pass this data back to GIS representation (such as a shapefile) of the loaded KML data. The result is a color coded selection set of data, or a new window that holds whatever feature data I would like to see from another server (or local data).
I can also use the coordinate to calculate a buffer that is loaded in as KML. I can also use this data to select other data.
You can also create very quick sketches directly in Google Earth that can be saved as shapefiles, or sent out to other clients for collaboration. Much more to come on this.
If you pass this method normalized screen coordinates from the GE Render window, it will return the Latitude, Longitude, and elevation of that point in Google Earth. This opens up an enormous amount of potential for using Google Earth as your GIS interface.
Google has always maintained that they are not a GIS, and they are right. But they have a great visualization system. All that is needed is a way to interact with their interface in a way that makes sense for GIS types of applications. All of the GIS activity can than go on behind the scene.
As an example, I can now click anywhere on Google Earth and capture the coordinates. I can also drag a rectangle across the screen and define its actual location within GE. I can then pass this data back to GIS representation (such as a shapefile) of the loaded KML data. The result is a color coded selection set of data, or a new window that holds whatever feature data I would like to see from another server (or local data).
I can also use the coordinate to calculate a buffer that is loaded in as KML. I can also use this data to select other data.
You can also create very quick sketches directly in Google Earth that can be saved as shapefiles, or sent out to other clients for collaboration. Much more to come on this.
GIS for Google Earth: Final Testing
[Note: Final testing for Shape2Earth is complete. Shape2Earth Version 1.0 is has been released as shareware, and is available for download at http://shape2earth.com]
The final beta version of Shape2Earth is ready for testing. I am particularly interested in international users, as I have had some issues with coordinates being written without decimals, and I want to make sure that is working.
This version also has a licensing manager built in to it. It will operate in full mode for 7 days, but then must be licensed.
Beta testers will receive the license to extend the use of the software until the final release.
Any interested persons may contact me at Sabin21@gmail.com
The final beta version of Shape2Earth is ready for testing. I am particularly interested in international users, as I have had some issues with coordinates being written without decimals, and I want to make sure that is working.
This version also has a licensing manager built in to it. It will operate in full mode for 7 days, but then must be licensed.
Beta testers will receive the license to extend the use of the software until the final release.
Any interested persons may contact me at Sabin21@gmail.com
Labeling GIS Data with Shape2Earth
One of the most requested functional additions for Shape2Earth has been the ability to label polygons. This is now possible with the use of a centroid function that creates a point in the middle of the polygon for the label.
In the example below, I will be labeling major lakes in the United States.
First, I open up Shape2Earth from MapWindow GIS
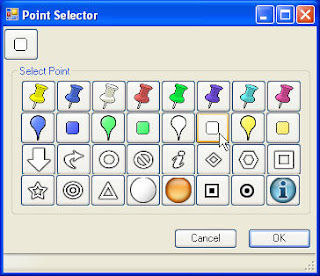
If I want there to be only text, I make the size of the icon zero, and do not add a label rollover. If I want to make it a bit fancier, I can select one point for the label, and another that is displayed when the user rolls over it.
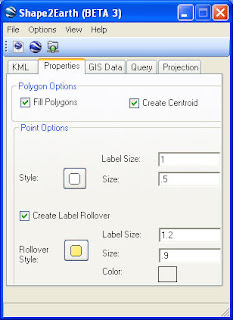
Finally, I can select which attribute field I want to use to label each polygon. I can also select to sort the features so that they will be displayed in alphabetical order.
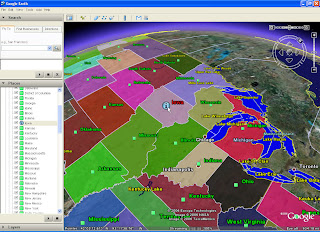
In the example below, I will be labeling major lakes in the United States.
First, I open up Shape2Earth from MapWindow GIS

Then, from the Properties tab, I select the points that I want to use for the labels using the Enhanced Point Selector dialog box.
If I want there to be only text, I make the size of the icon zero, and do not add a label rollover. If I want to make it a bit fancier, I can select one point for the label, and another that is displayed when the user rolls over it.

Finally, I can select which attribute field I want to use to label each polygon. I can also select to sort the features so that they will be displayed in alphabetical order.
 A simple result is show below.

These methods can be used to make some rather sophisticated views in Google Earth

Tuesday, December 05, 2006
Personal Geodatabase Feature Classes in Shape2Earth
Another interesting thing that I have been poking around at for some time is the ability to read ESRI Access Personal Geodatabases directly from their binary representation without the need for ArcObjects. The trickiest part of this was having to interpolate curves. I have this working to a reasonable degree.
The current prototype exports PGDB feature classes to KML, Shapefiles, and into SQL for importing GIS data into PostGIS, and has been tested with PGDBs created with ArcGIS 9.1 and 9.2. This opens more data for use with Shape2Earth.
I have been assuming that the same binary structure used in Access databases are also used by ArcSDE, but have not had the chance to test this theory out.
This same method could be used to create and edit Personal Geodatabase (and ArcSDE for that matter), but I doubt I’ll ever have the time to see this through.
The current prototype exports PGDB feature classes to KML, Shapefiles, and into SQL for importing GIS data into PostGIS, and has been tested with PGDBs created with ArcGIS 9.1 and 9.2. This opens more data for use with Shape2Earth.
I have been assuming that the same binary structure used in Access databases are also used by ArcSDE, but have not had the chance to test this theory out.
This same method could be used to create and edit Personal Geodatabase (and ArcSDE for that matter), but I doubt I’ll ever have the time to see this through.
Monday, October 30, 2006
Shape2Earth Beta 3
[UPDATE:
Shape2Earth Beta 3 input provided an enormous amount of help in the finalization of Shape2Earth. Shape2Earth Version 1.0 is now available for download at http://shape2earth.com]
I have recently been able to start work on Shape2Earth Beta 3. Work so far has focused on a couple of fixes and enhancements or adjustments to current functionality.
I am cleaning up the 3D section and adding the ability to use Z values. Clamping features to the Earth will happen automatically if there are no height values (greater than zero) for all of the points in the feature.
Shape2Earth has better handling for zero geometries, which are very common in data that is typically derived from CADD. Previously, if there were any features with zero geometry, the resulting kml document would be blank of any data.
I would like for Shape2Earth to be able to handle the sorting of features based on an attribute to be a bit more user friendly. It currently requires the user to set three different values in three different areas to work. This will be consolidated into a single area.
I will probably build a separate form that can be used to better control the symbology of the features. Users will have an easier time selecting point symbols, and will have greater control over setting the colors for lines and polygons.
I have added a centroid function that creates a ‘center-point’ for polygons. This can be used for labeling.
I am adding better instructions on how to make sure that the shapefile is projected properly.
Users will also be able to only export a subset of the features in the feature class (such as only those in the current view, or those that have been selected).
Users will be able to export the view as a PNG overlay image.
I am also doing some experimenting with collada models. In some cases, lifelike models can be used to represent the features from the shapefile. This can be used in conjunction with the new features found in KML 2.1 to display features at different distances as different symbols (a generic circle at a great distance would be displayed as a model when the user gets close enough to see the model appropriately).
Shape2Earth Beta 3 input provided an enormous amount of help in the finalization of Shape2Earth. Shape2Earth Version 1.0 is now available for download at http://shape2earth.com]
I have recently been able to start work on Shape2Earth Beta 3. Work so far has focused on a couple of fixes and enhancements or adjustments to current functionality.
I am cleaning up the 3D section and adding the ability to use Z values. Clamping features to the Earth will happen automatically if there are no height values (greater than zero) for all of the points in the feature.
Shape2Earth has better handling for zero geometries, which are very common in data that is typically derived from CADD. Previously, if there were any features with zero geometry, the resulting kml document would be blank of any data.
I would like for Shape2Earth to be able to handle the sorting of features based on an attribute to be a bit more user friendly. It currently requires the user to set three different values in three different areas to work. This will be consolidated into a single area.
I will probably build a separate form that can be used to better control the symbology of the features. Users will have an easier time selecting point symbols, and will have greater control over setting the colors for lines and polygons.
I have added a centroid function that creates a ‘center-point’ for polygons. This can be used for labeling.
I am adding better instructions on how to make sure that the shapefile is projected properly.
Users will also be able to only export a subset of the features in the feature class (such as only those in the current view, or those that have been selected).
Users will be able to export the view as a PNG overlay image.
I am also doing some experimenting with collada models. In some cases, lifelike models can be used to represent the features from the shapefile. This can be used in conjunction with the new features found in KML 2.1 to display features at different distances as different symbols (a generic circle at a great distance would be displayed as a model when the user gets close enough to see the model appropriately).
Thursday, July 06, 2006
Shape2Earth Instructions
Shape2Earth is a quick and easy way to convert GIS files into Keyhole Markup Language for viewing in Google Earth.
Instructions on how to use Shape2Earth Version 1.0 have been posted at this Shape2Earth Users Blog.
Instructions on how to use Shape2Earth Version 1.0 have been posted at this Shape2Earth Users Blog.
Monday, June 26, 2006
Advanced Touring in Google Earth
Way back when I first started investigating using Google Earth as a near real-time visualization client for a GIS, I stumbled upon GE’s very small API. For those of you not familiar with the term, an API is the Application Programming Interface for an application. It provides programmatic control to certain parts of the program.
The API for Google Earth is very small and experimental. The GE engineers did not make it publicly known, and do not support it (I am somewhat inclined to believe that that might change in the future). One of the things you can do is tell GE where to move to and how fast to move there. You can also tell it to load a kml file. I used these two very simple commands to create long running tours. You can really make some neat things happen when you have GE slowly spiral in and then quickly change directions. Coupling this with the dynamic loading and unloading of data makes for some really powerful visual presentations. These original tours were hard coded, and were begging for some automation.
To create the tours, I had built a small application that would capture the Latitude, Longitude, Range, Tilt, and Azimuth of my current view in GE. I could then paste the data into my move function in the Tour applications.
Over time, I have changed things quite a bit so that I can persist the views in XML. I can also set the movement speed and movement hold time using the user interface to get better movement effects, and then jump back and forth between each view to see how the overall movement looks.
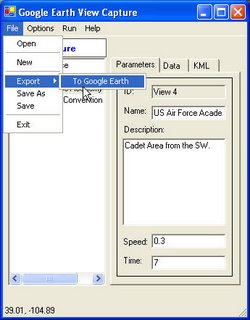
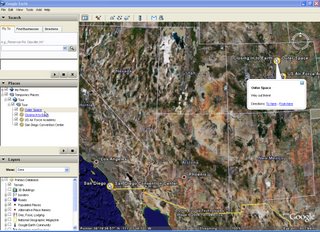
Once a tour has been made, it can be saved as XML and used by others (assuming they have the same program). Eventually, I should be able to set it up so that people can quickly create their own fly-throughs and data loading sequences to demonstrate and or brief.
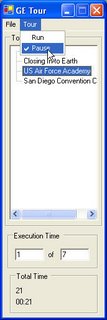
Some examples of how this can be used is as an education briefing (fly around to different geological areas of interest and load data to both highlight the area display text to describe it), operational briefings (Air Force pilots can be taken through a mission with data popping into view and described as required), engineering (this has already been used to tour through large scale engineering, construction, and logistics phases).
The uses are nearly endless.
The API for Google Earth is very small and experimental. The GE engineers did not make it publicly known, and do not support it (I am somewhat inclined to believe that that might change in the future). One of the things you can do is tell GE where to move to and how fast to move there. You can also tell it to load a kml file. I used these two very simple commands to create long running tours. You can really make some neat things happen when you have GE slowly spiral in and then quickly change directions. Coupling this with the dynamic loading and unloading of data makes for some really powerful visual presentations. These original tours were hard coded, and were begging for some automation.
To create the tours, I had built a small application that would capture the Latitude, Longitude, Range, Tilt, and Azimuth of my current view in GE. I could then paste the data into my move function in the Tour applications.
Over time, I have changed things quite a bit so that I can persist the views in XML. I can also set the movement speed and movement hold time using the user interface to get better movement effects, and then jump back and forth between each view to see how the overall movement looks.
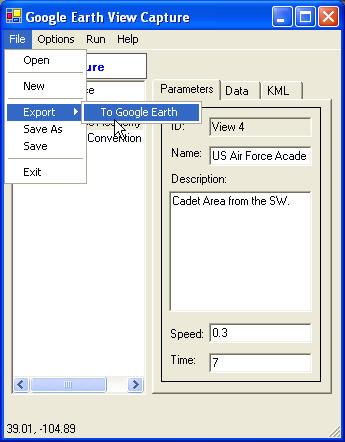
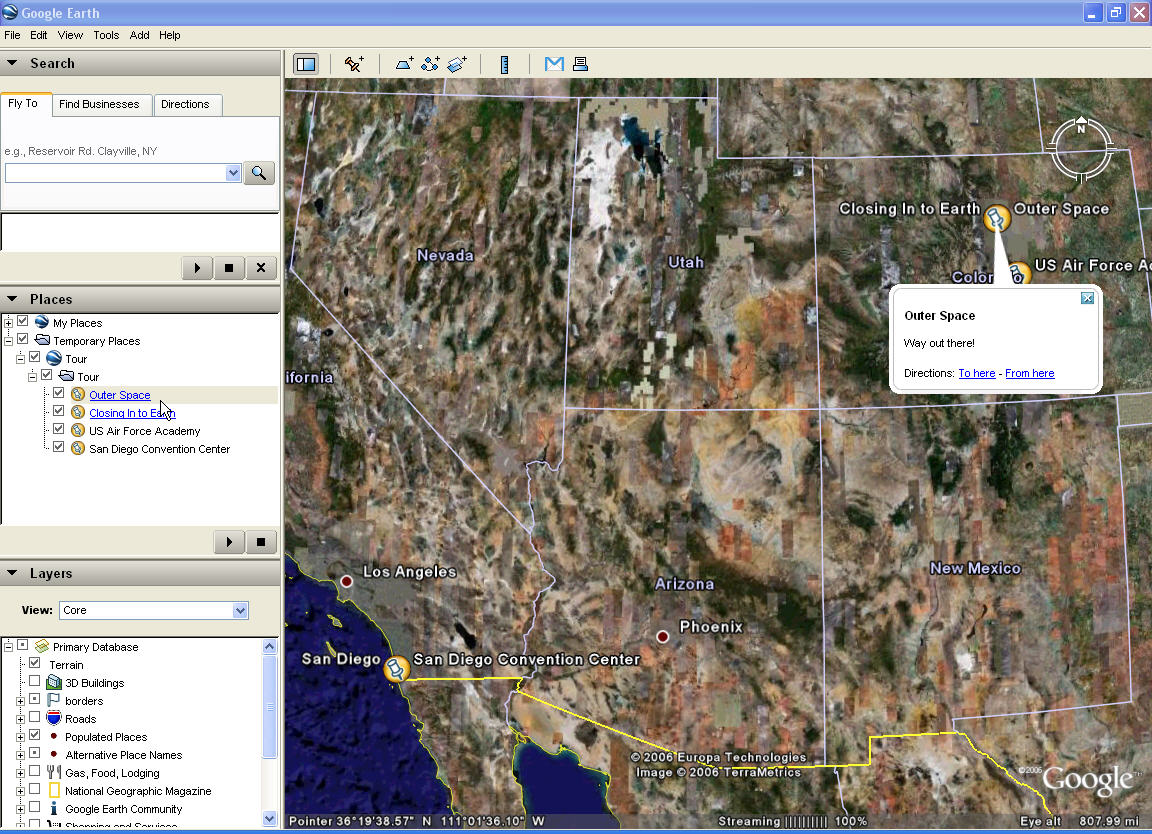
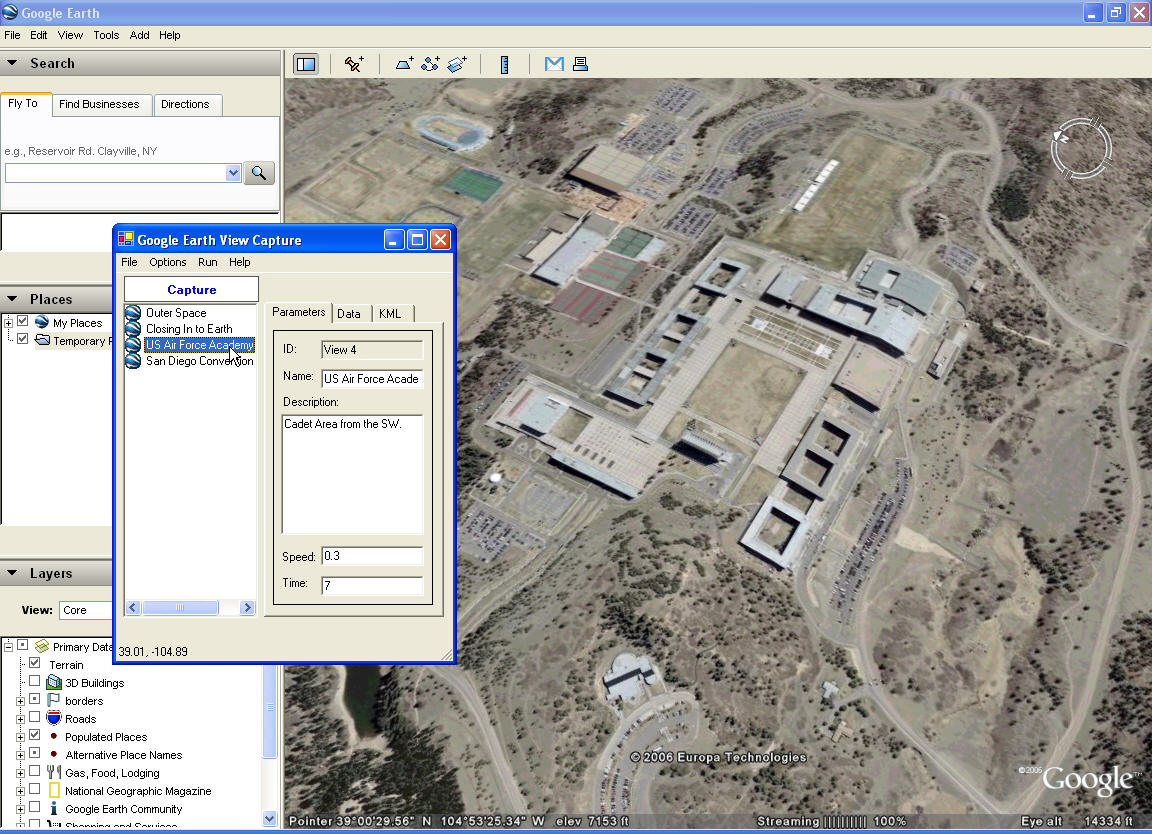 I have also written a little utility so that you can export the tour as point placemarks in Google Earth. These placemarks keep the name and description information (viewed in the information balloon), and lets the application act as a very quick way to set placemarks defining features found in GE.
Once a tour has been made, it can be saved as XML and used by others (assuming they have the same program). Eventually, I should be able to set it up so that people can quickly create their own fly-throughs and data loading sequences to demonstrate and or brief.

Some examples of how this can be used is as an education briefing (fly around to different geological areas of interest and load data to both highlight the area display text to describe it), operational briefings (Air Force pilots can be taken through a mission with data popping into view and described as required), engineering (this has already been used to tour through large scale engineering, construction, and logistics phases).
The uses are nearly endless.
Sunday, June 18, 2006
Google Earth -- World Wind -- ArcExplorer
I was recently at an Air Force conference where Google Earth, NASA’s World Wind, and ESRI’s ArcExplorer where prominently displayed. The serious interest that organizations like the Air Force are putting into these platforms has given me the opportunity to explore each of these platforms a bit more in depth.
I am still using Google Earth a great deal. I don’t believe that it can currently be challenged in its ease of use and clean navigation. My 5 year old loves to play with Google Earth, and has no trouble getting around the planet to points of interest. Their KML data representation and the use of Network links to serve data offer a very interesting and open way to create very unique customizations. For organizations with a very large amount of data, it is tough to beat their server products. This would work very well for the Air Force, which could leverage their own imagery holdings with other services and NGA to create their own world for Air Force specific applications and visualizations.
Things I wish they would do …. Currently, Google Earth offers a couple of methods to integrate existing GIS data into their system. You can load KML files, or you can purchase their Fusion product that compiles your data into a format that can be hosted by their Earth Server product into a Google Earth Enterprise Client (the Google Earth Browser with extended features). You have two options with the Earth Server. You can either have a hybrid system in which you load your vector data into the Earth Server and view it against the Keyhole server imagery. Or you can get Enterprise Pro, and host ALL of the data in your own world.
The whole Google Earth product line is really an enterprise system. It works best when everything is put together. I would like to see what I would term an organizational level system (as opposed to enterprise). An example would be using a Windows 2003 Server to host organizational data (to include imagery) that can be securely fused with the larger Keyhole imagery server. The great majority of organizations don’t want to just load their vector data in the big Linux based Google Earth Server in a hybrid mode, or be responsible for populating an entire world if they have localized imagery. They want to view their holdings fused against the Google data.
Secondly, if the Google Earth Client could expose some additional capabilities to developers in their API, the GIS community could rapidly start tacking on some pretty sophisticated geoprocessing capabilities.
I finally got around to downloading the World Wind source code, and started investigating their method for creating Plugins. I have seen World Wind improve quite a bit over the last year. And believe that it will continue to get better. Its unique power in this game is that it is open source and license free. They automatically provide the ability to completely customize the user interface and provide the ability for any developer to integrate any type of GIS data. I am currently working on an extension that uses Yahoos geocoding service to search for locations and zoom to them in WW.
I have only seen ESRI’s ArcExplorer in Beta. I will withhold my comments on it until it is released. It will probably work very well for anyone who already has an investment in an ESRI based system. I am looking forward to doing some development work with it before the end of the year.
I am still using Google Earth a great deal. I don’t believe that it can currently be challenged in its ease of use and clean navigation. My 5 year old loves to play with Google Earth, and has no trouble getting around the planet to points of interest. Their KML data representation and the use of Network links to serve data offer a very interesting and open way to create very unique customizations. For organizations with a very large amount of data, it is tough to beat their server products. This would work very well for the Air Force, which could leverage their own imagery holdings with other services and NGA to create their own world for Air Force specific applications and visualizations.
Things I wish they would do …. Currently, Google Earth offers a couple of methods to integrate existing GIS data into their system. You can load KML files, or you can purchase their Fusion product that compiles your data into a format that can be hosted by their Earth Server product into a Google Earth Enterprise Client (the Google Earth Browser with extended features). You have two options with the Earth Server. You can either have a hybrid system in which you load your vector data into the Earth Server and view it against the Keyhole server imagery. Or you can get Enterprise Pro, and host ALL of the data in your own world.
The whole Google Earth product line is really an enterprise system. It works best when everything is put together. I would like to see what I would term an organizational level system (as opposed to enterprise). An example would be using a Windows 2003 Server to host organizational data (to include imagery) that can be securely fused with the larger Keyhole imagery server. The great majority of organizations don’t want to just load their vector data in the big Linux based Google Earth Server in a hybrid mode, or be responsible for populating an entire world if they have localized imagery. They want to view their holdings fused against the Google data.
Secondly, if the Google Earth Client could expose some additional capabilities to developers in their API, the GIS community could rapidly start tacking on some pretty sophisticated geoprocessing capabilities.
I finally got around to downloading the World Wind source code, and started investigating their method for creating Plugins. I have seen World Wind improve quite a bit over the last year. And believe that it will continue to get better. Its unique power in this game is that it is open source and license free. They automatically provide the ability to completely customize the user interface and provide the ability for any developer to integrate any type of GIS data. I am currently working on an extension that uses Yahoos geocoding service to search for locations and zoom to them in WW.
I have only seen ESRI’s ArcExplorer in Beta. I will withhold my comments on it until it is released. It will probably work very well for anyone who already has an investment in an ESRI based system. I am looking forward to doing some development work with it before the end of the year.
Thursday, June 01, 2006
Download Shape2Earth Beta 2
UPDATE: Shape2Earth Beta 2 testing has closed. Shape2Earth Version 1.0 hase been released as shareware, and is available for download below.
http://shape2earth.com
http://shape2earth.com
Subscribe to:
Posts (Atom)